
One of my features I find the most useful in the Service Fabric SDK tools for Visual Studio is the Streaming Trace Viewer window in Visual Studio. This is used to provide a streaming (i.e. close to real-time) view of the events generated by the SF runtime and the application running on the cluster. You can learn more about this feature from the official docs.
What is not immediately obvious about this feature is that this is just a generic ETW event listener, and so becomes useful on a whole bunch of other scenarios.
##Launching the Diagnostics Viewer If you read the documentation above, you’ll have noticed that you can open the streaming trace viewer from the Cloud Explorer tool window:
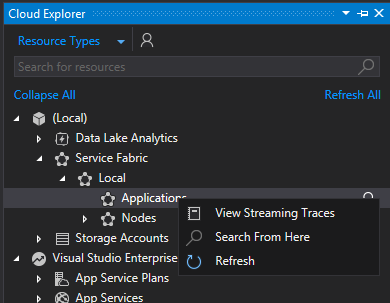
One big downside of this is that it requires not only that you have the Service Fabric SDK installed, but also that you have a local Service Fabric cluster deployed, and started.
##Capturing ETW Traces When the Diagnostics Viewer window opens, it is by default configured to collect traces from the Service Fabric ETW providers, which are:
Microsoft-ServiceFabric-Actors
Microsoft-ServiceFabric-Services
Microsoft-ServiceFabric:4:0x4000000000000000
Each line is basically the name of the ETW provider to enable. You can optionally specify the trace level and the keywords in the provider to enable, which allows you to be more selective about which ETW events to capture. If you’re familiar with using other providers in PerfView, you’ll recognize the syntax right away.
The beauty on this is that you can easily change the list of ETW providers that are enabled by clicking on the little gearbox icon (third one from the left):
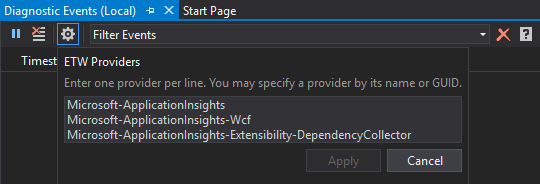
In the example above, I’m enabling some of the ETW providers in the Application Insights SDK to troubleshoot some issues related to dependency collection. Once you’ve customized the list, press the Apply button so it takes effect.
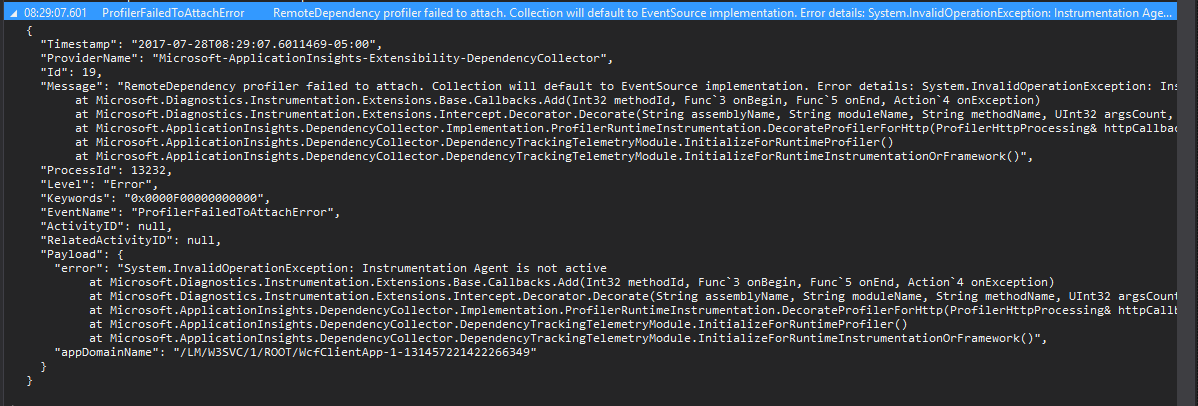
##Viewing Events Once collection is started, you can watch events scroll by on the grid:

You can also pause and restart the trace at any time using the first button at the top-left. For each event, you’ll notice that a TimeStamp, the event name and the textual message associated with the event will be displayed. However, you can also expand an event to view the full event detail in JSON format:
Also not immediately obvious: You can right-click on an event and select the “Copy Event” command from the context menu. This will copy the full JSON details to the clipboard.
##Conclusion ETW events are a fantastic tool in Windows and .NET for troubleshooting all kinds of issues. I’m a huge fan of PerfView; it’s an amazing tool and extremely useful. However, often I need something simpler to capture simpler events.
Overall, the Service Fabric Diagnostics Viewer is an awesome tool for this scenario, as it saves me the trouble of having to start a collection, reproducce a problem, and then wait until the trace is viewable to understand what’s going. For simpler scenarios, this is a far more productive way of going about it.
My only wish here is: I would love to have this as a standalone Visual Studio extension unrelated to Service Fabric. And if not that, at least be able to start the diagnostics viewer without having to have a local Service Fabric node deployed!
